A warehouse without KPIs is managed by feel. Managers know something is wrong when orders pile up or complaints come in — but by then, the problem has usually been building for days. A well-designed KPI system shifts management from reactive to proactive: you see degradation in pick accuracy or throughput before it becomes a customer complaint, and you can trace the cause to a specific process failure rather than a vague "team problem."
The 5 KPI Categories
Most warehouses track only output metrics — orders shipped today, parcels scanned, daily throughput — without tracking the quality and accuracy metrics that predict future failures. Output numbers look good until they don't. Accuracy and cycle time metrics give you early warning before the output collapses.
1. Inbound KPIs
Inbound is where inventory data quality is born or broken. Errors at receiving — wrong counts, unlabelled items, wrong location put-away — propagate forward into every downstream process. Poor inbound KPIs are the most common root cause of low inventory accuracy.
| Metric | Formula | Target | What it tells you |
|---|---|---|---|
| Receiving accuracy | 正确入库件数 / 总入库件数 | ≥ 99.5% | Whether quantities and SKUs match the PO at receiving time |
| Putaway timeliness | 4h内完成上架的批次 / 总到货批次 | ≥ 95% | Whether goods are available to pick quickly after arrival; unput-away stock can't be allocated to orders |
| Receiving efficiency | 入库件数 / 人工时 | Baseline by op type | Labor cost per unit received; track week-over-week for trend |
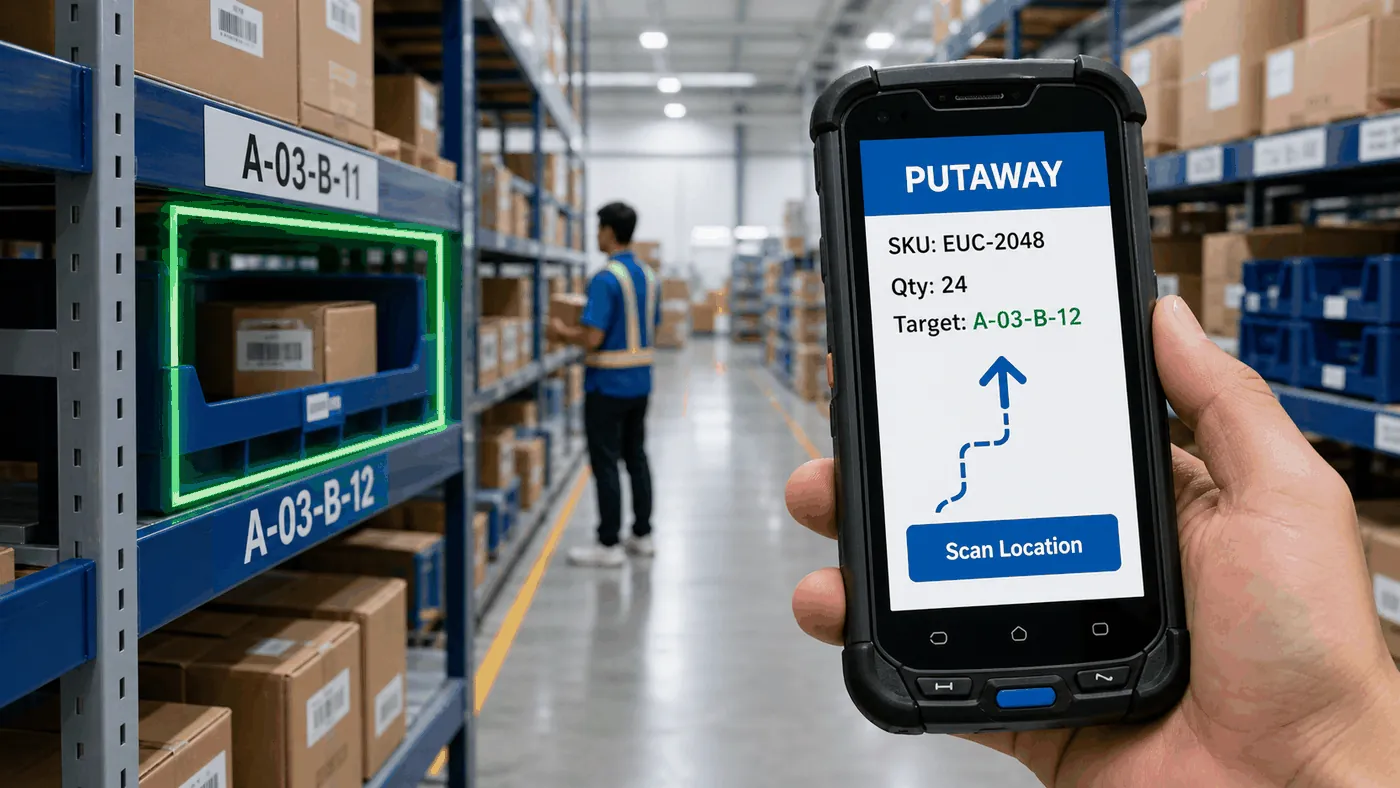
| Location compliance | 上架到指定库位的件数 / 总上架件数 | 100% | Whether every SKU is put away to its designated location — random put-away is the #1 driver of inventory discrepancy |
2. Inventory KPIs
Inventory KPIs measure both data quality (accuracy) and business health (turnover, dead stock). Inventory accuracy underpins everything — an inaccurate inventory means your system thinks stock is available when it isn't, leading to order holds, emergency stock searches, and pick failures. Turnover metrics connect the warehouse to procurement: if the warehouse is full but turnover is slow, the problem isn't space — it's buying decisions.
| Metric | Formula | Target | What it tells you |
|---|---|---|---|
| Inventory accuracy | 盘点相符SKU数 / 总盘点SKU数 | ≥ 99.5% | The foundation metric — see our full guide on achieving 99%+ |
| Inventory days on hand | 平均库存量 ÷ 日均出库量 | FMCG <30d / Apparel 60–90d | How quickly stock is moving; high days = capital tied up in slow stock |
| Dead stock ratio | 90天未出库SKU数 / 总SKU数 | ≤ 10% | % of your SKU catalog that hasn't moved in 90 days — space and capital tied up in stock that isn't selling |
| Space utilisation | 已占用库位 / 总库位数 | 75–85% | >85% leaves no buffer for inbound; <70% means you're paying for empty space |
3. Outbound KPIs
Outbound KPIs are the ones most visible to the customer — late shipments and wrong items are the two errors that generate complaints. But these customer-facing outcomes are downstream of operational process metrics. Tracking pick accuracy and order cycle time gives you the ability to catch issues before shipments leave the building.
| Metric | Formula | Target | What it tells you |
|---|---|---|---|
| On-time shipment rate | 按时发出订单数 / 总应发订单数 | ≥ 98% | The most customer-visible KPI; drops below 95% trigger platform penalties on Shopee/Lazada |
| Pick accuracy rate | 无差错订单数 / 总出库订单数 | ≥ 99.8% | Error rate per 1,000 orders; <99.5% indicates a process problem, not a people problem |
| Order cycle time | 扫描出库时间 − 订单创建时间 | SLA-dependent | End-to-end speed from order to ship; sudden increases point to bottlenecks in pick, pack, or manifest |
| Order fill rate | 完整发出订单 / 收到的总订单数 | ≥ 99% | % of orders shipped complete and on time; low fill rate = inventory shortages or SKU stockouts |
4. Labor efficiency KPIs
Labor is typically 60–70% of total warehouse operating cost. Labor KPIs tell you whether you're getting the expected output from your headcount — and they're often the fastest leading indicator of operational problems. A sudden drop in units per person per hour usually points to a process disruption (system downtime, label printer failure, congestion at a staging area) rather than a workforce problem.
| Metric | Formula | Reference | What it tells you |
|---|---|---|---|
| Pick rate | 拣货件数 / 人工时 | 100–300 units/hr (method-dependent) | Baseline varies significantly by picking method and item size; track trend, not absolute value |
| Orders processed per person | 日均出库订单数 / 出库岗位人数 | Set internal baseline | Overall outbound productivity; useful for staffing planning and shift comparisons |
| Overtime rate | 加班工时 / 总工时 | ≤ 15% | A proxy for whether headcount and workflow design can handle daily volume — chronic overtime signals a structural capacity problem |
5. Quality & exception KPIs
Quality metrics capture the errors that leak through — wrong items shipped, damaged goods, returns that take too long to process back into sellable inventory. These are low-frequency but high-cost events. An error rate of 0.5% sounds small; at 1,000 orders per day, that's 5 wrong shipments — 5 customer service tickets, 5 return logistics costs, and 5 potential negative reviews, every single day.
| Metric | Formula | Target | What it tells you |
|---|---|---|---|
| Wrong shipment rate | 错发订单数 / 总出库订单数 | ≤ 0.1% | Direct measure of pick and pack process quality; above 0.2% requires immediate root-cause investigation |
| In-warehouse damage rate | 破损货值 / 月均库存货值 | ≤ 0.05% | Damage caused by storage, handling, or picking — not transit damage; points to racking issues or mis-matched equipment |
| Return processing time | 退货到上架可售的平均时长 | ≤ 24h for same-day resale | Returns sitting unprocessed are lost revenue — they appear in inventory as "pending" but can't be allocated to new orders |
Two reporting layers: daily operations vs monthly management
Not all KPIs need to be reviewed at the same frequency. Operational KPIs — throughput, pick rate, on-time rate for today's waves — need to be visible in real time or at most daily. Management KPIs — inventory turnover, labor cost per unit, monthly fill rate — are meaningful at a weekly or monthly cadence. Mixing these audiences produces reports that are too noisy for operations and too granular for executives.
Why KPIs are only as good as the data beneath them
The KPI framework above is only useful if the underlying data is captured automatically and in real time. In a warehouse running on spreadsheets or paper-based processes, most of these metrics either don't exist or are calculated manually at the end of the week — by which point the data is stale and the problems have already compounded.
A WMS captures the data for most of these KPIs as a by-product of normal operations: every scan at receiving creates a receiving accuracy record; every pick scan records pick time, location, and picker ID; every shipment scan records cycle time. The KPI dashboard is a view on top of operational data that already exists — it doesn't require extra work from the warehouse team to produce.
The question to ask when evaluating a WMS isn't "does it have a reports module?" — it's "which of these KPIs does it calculate automatically, and how granular can I slice the data?" The answer tells you whether the system can support operational management or only post-hoc reporting.